Over on Twitter, Gray Kimbrough suggests using colour to indicate statistical significance/p-values instead of the traditional stars. This was part of a broader argument for Powerpoint over Beamer.
I much prefer Beamer to Powerpoint, and I knew it would be very easy to implement coloured cells in regression tables directly from Stata into LaTeX/beamer.
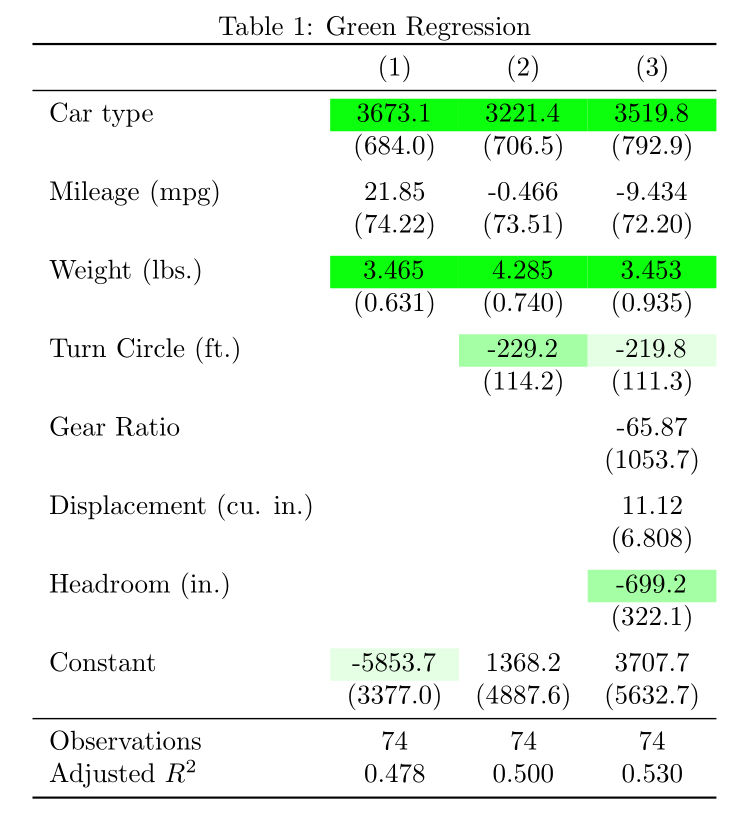
I use the wonderful estout to produce regression tables (and have modified it in the past) so here’s how to produce the table above with one extra line in your do-file.
clear
sysuse auto

** This line generates a local named siggreen, defining significance with green opacity
local siggreen "star(\cellcolor{green!10} 0.10 \cellcolor{green!35} 0.05 \cellcolor{green!95} 0.01) nonotes"

** Run a few sample regressions
qui eststo: reg price foreign mpg weight
qui eststo: reg price foreign mpg weight turn
qui eststo: reg price foreign mpg weight turn gear_ratio displacement headroom

** Using esttab, produce the output with Enda's preferred options
esttab using myoutput.tex, replace booktabs nodepvars nomtitle se label ar2 `siggreen' title("Green Regression")
Then, to include that table into your TeX document:
\documentclass{article}
\usepackage[table]{xcolor}
\usepackage{booktabs}
\begin{document}
\input{myoutput}
\end{document}
If you want to include this tables in your Beamer slides, see this post.