It is occasionally useful to create maps where each geographic unit is given equal visual prominence. This is particularly true in economics/political science, where land area can be poorly correlated with the information you’re really trying to depict. For example South Dakota has about twice the land area of Kentucky, but has fewer than one-fifth of the population.

One way to deal with this is a hexagonal tile grid map, and NPR gives good examples of their application to U.S. states. I’ve adapted code to facilitate something similar for Ireland’s 32 counties in Stata. (I was working with 1800s population data, before Northern Ireland existed, so the code is based on the 32 counties.) The images are generated by spmap and maptile, and you can use their in-built options to change the appearance. The map is implemented as what maptile calls a “geography”, and I’ve named this geography eirtile.

The first requirement is installation of both spmap and maptile, both of which are available from the SSC.

Next, click this link to download the eirtile database and coordinate files. These need to be unzipped into the maptile geographies folder, located within your Stata ado folder. For me that’s C:\ado\personal\maptile_geographies though it might be different for you. You may also want to download this 1841 Census population file to replicate the example.

An important requirement is that you have a variable named countyid to link your data to the database coordinates. The ordering is alphabetic, so Antrim is countyid=1 and Wicklow is countyid=32. The code will still run if observations are missing, so it’s not the end of the world if you don’t have data from the six NI counties.

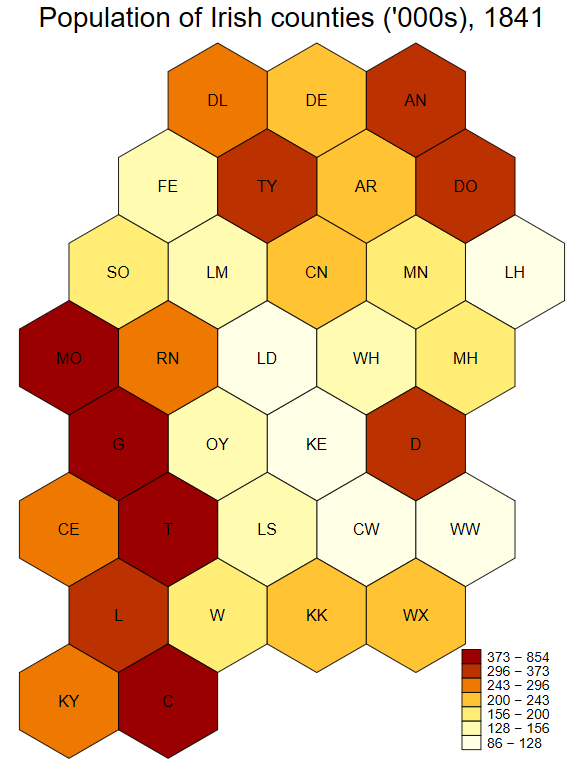
The code below generates the 1840 population image.

insheet using "1841pops.csv", clear names
destring pop, replace ignore(",")
gen pop_per_thousand = round(pop/1000)
sort County
gen countyid = _n
maptile pop_per_thousand, geog(eirtile) geoid(countyid) twopt(title("Population of Irish counties ('000s), 1841")) nq(7)

The first three lines open and clean the data. Lines 4 and 5 generate the necessary countyid variable, which serves as the link between your data and the mapping software. The last line calls maptile, tells it to map the population variable of interest, use eirtile as the geography, and that countyid is the identifier variable. The latter options (twopt and nq) are maptile-specific commands and you should consult that program’s help file for details. This help file also shows you how to change the colours, label the missing data, etc.

//

Most employees in Ireland are women. This fact does not imply that most workers are women, because men have a higher rate of self-employment. Nonetheless, most employees in Ireland are women.

Note that the male and female paths pre- and post-2008 are almost parallel, but there was a huge shift in the composition of the labour force in 2008-2009.

(Title of the post refers to this book.)

//

"Ireland is a place which must have so great an Army kept up in it, as may make the Irish desist from doing themselves or the English harm by their future Rebellions. And this great Army must occasion great and heavy Leavies upon a poor people and wasted Countrey; it is therefore not amiss that Ireland should understand the nature and measure of Taxes and Contributions."

-- William Petty (1662), A Treatise of Taxes & Contributions

//

Using data from each Census since 1841, here's a graph of Ireland's population. For consistency this is the population of the Republic; what would become Northern Ireland is excluded. Often it is mentioned that the population declined by a quarter because of the Famine, but rarely is it noted that it fell by another quarter in the next generation as well.

It continued to fall for more than 100 years after 1850.

//

If emigration had been included in the Olympics when they were first introduced, Ireland would be a great sporting nation. Nonetheless the scale of the emigration is sometimes slightly exaggerated.

I have seen it stated online that "Four out of every five children born in Ireland between 1931 and 1941 emigrated in the 1950s." (For example, here and here.) This is not true.

The claim first appears on p.379 of JJ Lee (1989) Ireland, 1921-1985: Politics and Society. This is an excellent book, but the claim is slightly incorrect. Lee attributes the claim to Tobin (1984:156) The Best of Decades. I tracked this book down on eBay. Tobin in turn was citing Garret FitzGerald, who wrote in the Irish Times in September 1966 that "[Current low unemployment] contrasts sharply with the position between 1954 and 1961 when net emigration averaged over 45,000 a year, or the equivalent of 80 per cent of those born eighteen or twenty years earlier."

FitzGerald notes that the emigration rate is "the equivalent" of 80% of those born twenty years earlier. This definition could include, for example, two thirty year-olds and their three small children. In that respect the original 80% statistic is stated too strongly: restricting emigration exclusively to those born between 1931 and 1941 invalidates the claim. We know that many of the emigrants of the 1950s were young children.

In summary, the statement that four out of every five children born in Ireland between 1931 and 1941 emigrated in the 1950s is incorrect. What is true is that around 57,000 were born each year in the 1930s, and around 45,000 people (i.e. about 80% of 57,000) emigrated each year in the 1950s. The starkness of that statistic doesn't require any exaggeration.

//
Scroll to Top