The university formerly known as NUI Galway (and before that, UCG) rebranded as University of Galway last year.

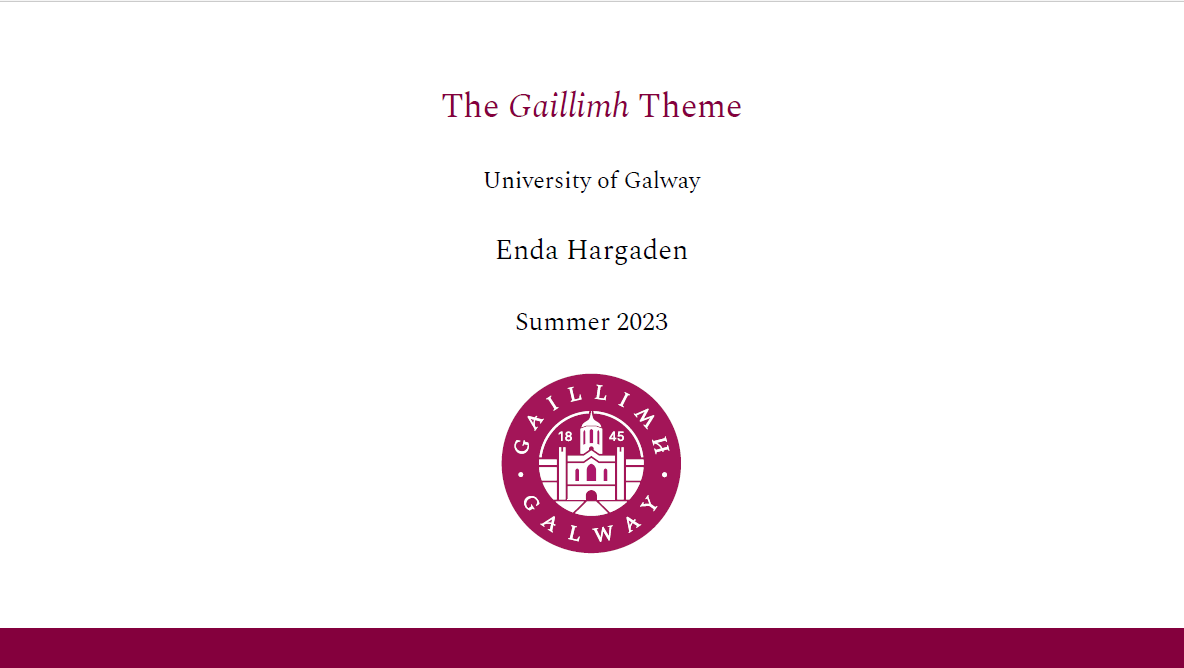
This post outlines how you can make beamer slides to match the university branding. The theme is called Gaillimh after the name of the city in the Irish language.

The theme should compile if you use pdflatex. However, full implementation requires you to use xelatex. This is because the official University branding is very clear that the font of preference is Spectral. This is a lovely font, freely available from Google Fonts, and you can even download it HERE, but pdflatex won’t let you use your own fonts. So if you want to use be very consistent with the branding and use Spectral, you will need to compile your document with xelatex.

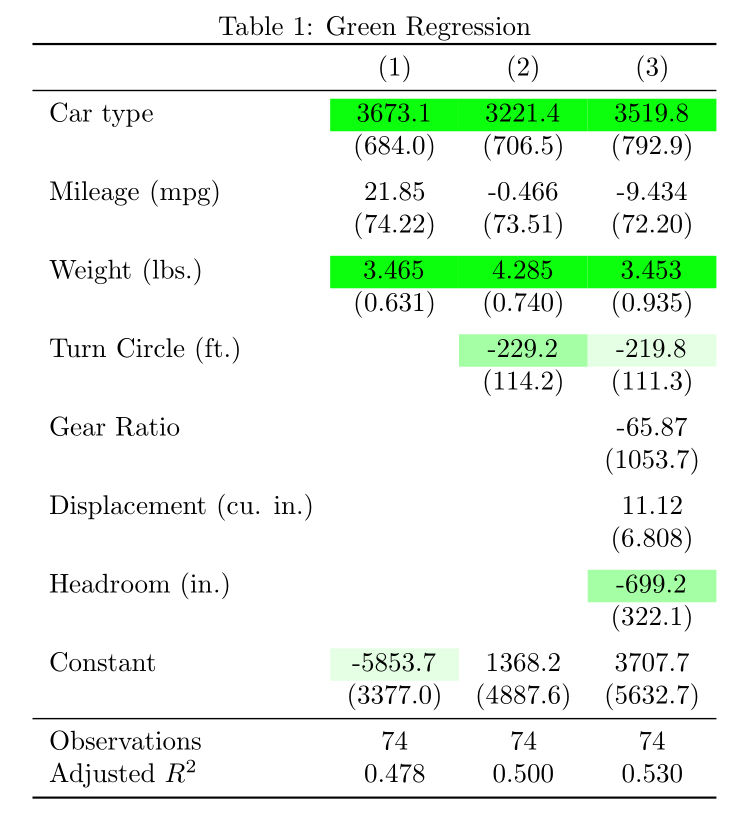
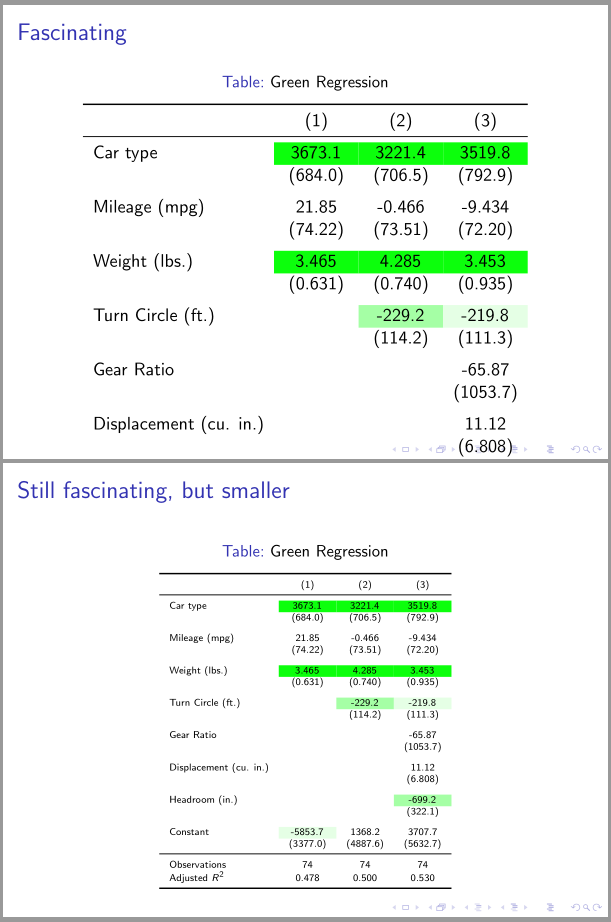
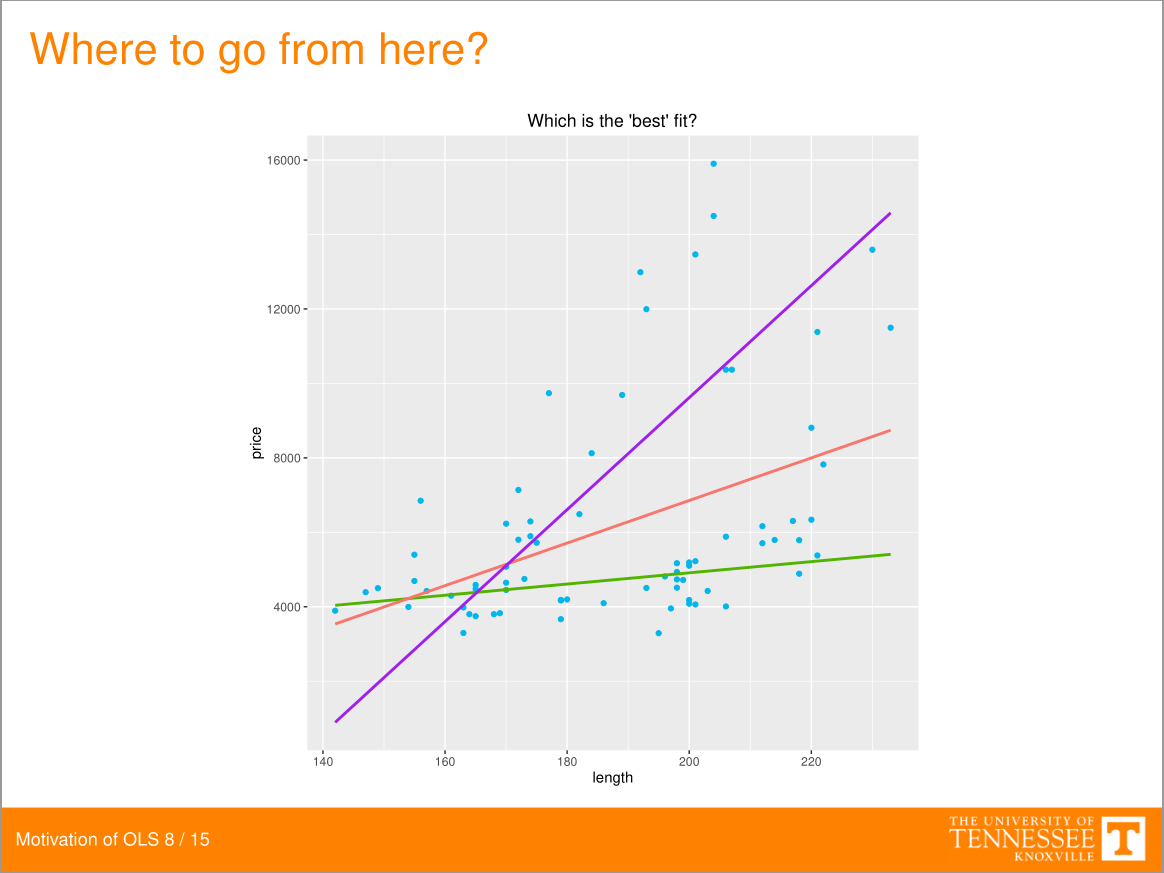
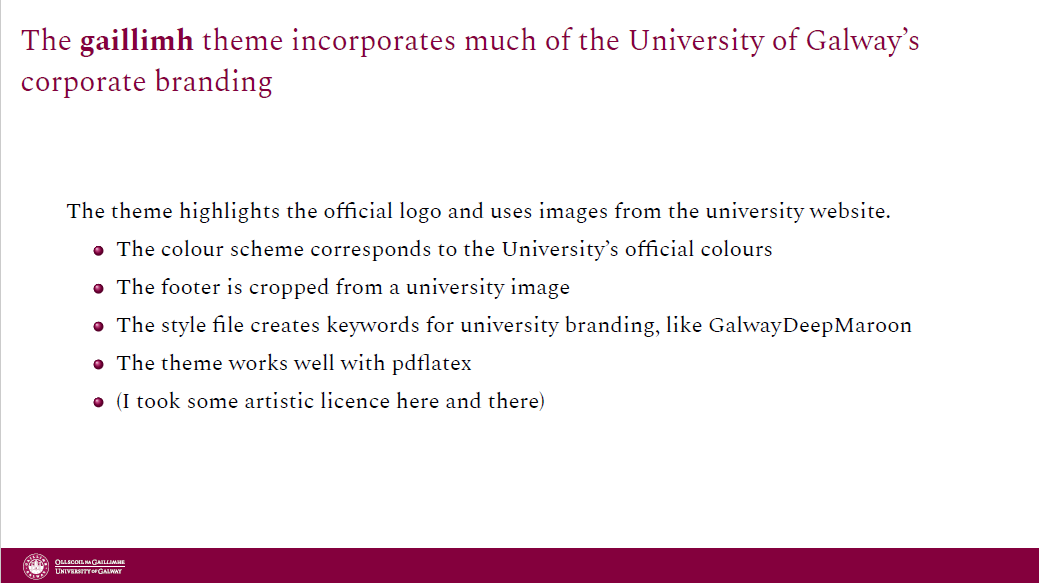
An example PDF of the Gaillimh theme is viewable HERE. I include a couple of screenshots below.

You can download all the files you need to install and use the theme in one zip-file HERE.

//

University College Dublin has an excellent, professionally-crafted visual identity. Credit where it’s due, the branding is distinctive and coherent.

But there isn’t a beamer theme. UCD Marketing have Powerpoints to beat the band, but I (and at least a dozen other people worldwide) prefer generating slidedecks in TeX.

So I have made a beamer theme to replicate the official UCD branding. There is a norm of naming beamer themes after university locations such as AnnArbor or Berkeley. The UCD beamer theme is thus named Belfield. Though the UCD brand is very well known on our island, this little bit of research infrastructure can help you represent the university internationally.

An example PDF of the Belfield theme is viewable HERE. I include a couple of screenshots below.

You can download all the files you need to install and use the theme in one zip-file HERE.

Alternatively you can download them individually. Instructions are available from the README.txt. Don’t skip the readme file, it helps with the installation. 

//

When exporting graphics from Stata or Matlab, it’s better to select a lossless/vectorized format instead of a rasterized pic. This ensures your image is high-quality and not grainy/pixelated.

Grainy exports

Poor quality, grainy image

Better quality export

Unfortunately, Matlab does not allow lossless PDF exports of pictures with non-standard fonts. (I’m not the first person to notice this problem. I failed to implement Juan Guerrero’s suggested solution.) Matlab will export the font in PNG no problem, but your image will appear grainy. If you try to export as a PDF, your fonts will be reverted to something weird. Obviously this doesn’t matter if you’re happy with the default fonts, but this bug does limit your ability to customize the output.

Thankfully, with the help of the nice people at Inkscape (https://inkscape.org/) there is a workaround.

  1. Install Inkscape
  2. Generate your figure in Matlab
  3. In “Export Setup”, change the Font to anything saved on your system. Export as Scalable Vector Graphic (SVG) file
  4. Open the SVG in Inkscape
  5. Save it a lossless PDF as, say, figure7.pdf
  6. Include in your LaTeX document with \includegraphics{figure7}

Done!

//

Usually my exams have a large blank space for students to write their names in.

If, instead, I wanted to generate individualised exams with their names printed in that space, this code will do that for you. It uses the pgffor package to loop over the list of names you provide.

\documentclass{article}
\usepackage{pgffor}
\def\classlist{Enda Hargaden,
George Akerlof,
Joe Stiglitz,
Don Bruce}
\pagenumbering{gobble}
\begin{document}
\foreach \studentname in \classlist{

Econ 381 Problem Set: \studentname's Copy

\begin{enumerate}
\item What is OLS?
\item What's the square root of 25?
\item More questions yadda yadda
\end{enumerate}

\newpage}

\end{document}
//

Over on Twitter, Gray Kimbrough suggests using colour to indicate statistical significance/p-values instead of the traditional stars. This was part of a broader argument for Powerpoint over Beamer.

I much prefer Beamer to Powerpoint, and I knew it would be very easy to implement coloured cells in regression tables directly from Stata into LaTeX/beamer.

I use the wonderful estout to produce regression tables (and have modified it in the past) so here’s how to produce the table above with one extra line in your do-file.

clear
sysuse auto

** This line generates a local named siggreen, defining significance with green opacity
local siggreen "star(\cellcolor{green!10} 0.10 \cellcolor{green!35} 0.05 \cellcolor{green!95} 0.01) nonotes"

** Run a few sample regressions
qui eststo: reg price foreign mpg weight
qui eststo: reg price foreign mpg weight turn
qui eststo: reg price foreign mpg weight turn gear_ratio displacement headroom

** Using esttab, produce the output with Enda's preferred options
esttab using myoutput.tex, replace booktabs nodepvars nomtitle se label ar2 `siggreen' title("Green Regression")

Then, to include that table into your TeX document:

\documentclass{article}
\usepackage[table]{xcolor}
\usepackage{booktabs}
\begin{document}
\input{myoutput}
\end{document} 

If you want to include this tables in your Beamer slides, see this post.

//

I’ve discussed in the past how to indicate statistical significance with colour rather than stars. Another concern people have about using Beamer is that it can be hard to squish results into one slide. In my opinion, that is solved very easily with my tinytable command.

\documentclass[xcolor={table}]{beamer}
\usepackage{booktabs}

\newcommand{\tinytable}[1]{\textcolor{black}{\tiny \input{#1} }}

\begin{document}
\begin{frame}
\frametitle{Fascinating}
\input{myoutput}
\end{frame}

\begin{frame}
\frametitle{Still fascinating, but smaller}
\tinytable{myoutput}
\end{frame}
\end{document} 

This generates the following:

//

The economic package includes old commands that are now deprecated within LaTeX. This caused me a problem using the AER bibliography style (aer.bst), and likely causes problems with other BibTeX styles too. My particular problem was with scrartcl refusing to recognise the \bf command rather than the newer \textbf version.

Very specifically, the problem was “Class scrartcl Error: undefined old font command `\bf’.”

The fix for this is simple. Just include the following two lines in the preamble of your document.

\DeclareOldFontCommand{\bf}{\normalfontbfseries}{\textbf}
\DeclareOldFontCommand{\it}{\normalfont\itshape}{\textit}

You could alternatively open up your *.bst file and manually change the code, but the two lines above should fix it.

//

I like being able to hide content in documents, for example including but not revealing the answers in a problem set. That makes it very easy to then produce the problem set solutions, simply by revealing the answers. I made this easier with a \hide{} command, that can be “turned off” so the answers are revealed.

This is the basic code I use for producing problem sets. The only change needed to convert a problem set into a solution set is to redefine the \showanswers variable to equal 1 rather than 0.

\documentclass{article}
% Set this =0 to hide, =1 to show
\def\showanswers{0}

\newcommand{\hide}[1]{
\ifnum\showanswers=1

#1 \vspace{\baselineskip}
\fi

\ifnum\showanswers=0

\vspace{2\baselineskip} \hspace{2cm}
\fi
}

\begin{document}

\begin{enumerate}
\item This is question 1.
\hide{Here is a hidden solution.}


\item What is the answer to question 2?
\hide{The answer is here.}
\end{enumerate}

\end{document}
//

I typeset the euro symbol (€) regularly and I’ve always thought the version produced in LaTeX sticks out a bit like a sore thumb. (I re-assure myself that noticing these things is evidence that I adequately proof-read my prose.) The code below makes a new command \yuro that (in my opinion) fits in better with the surrounding text.

\documentclass[12pt]{article}
\usepackage{eurosym}
\usepackage{graphicx}
\newcommand{\yuro}{\scalebox{0.95}{\euro}}
\begin{document}
This is the size with the \euro 1,000 original configuration.

This is the size with the \yuro 1,000 newer configuration.
\end{document}

The code shrinks the size of the symbol to make it fit better with other characters. Similarities to the status of the eurozone are unintentional.

//
Scroll to Top